
"Mathematics is the art of explanation. If you deny students the opportunity to engage in this activity— to pose their own problems, make their own conjectures and discoveries, to be wrong, to be creatively frustrated, to have an inspiration, and to cobble together their own explanations and proofs— you deny them mathematics itself." - Paul Lockhart, A Mathematician's Lament
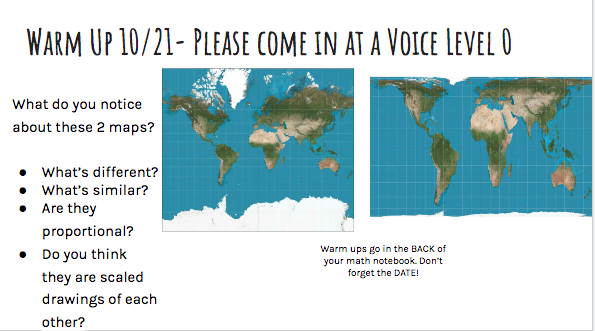
In this lesson, students took a critical perspective on the creation and usage of maps in American history through examining a Mercator map and a globe and determining whether or not there is a proportional relationship between the two. They measured distances on the maps and compared them with distances on the globe in order to discover that Africa is actually much larger than it appears on the Mercator map, and the equator is displayed a bit lower than it actually is. This made sense as the map was made during a period of colonial domination, when most of the world powers were European-- it was helpful to maintain an image of the world with Europe at the center and looking larger than it really was.
Students learned that, because the earth is a sphere, it’s impossible to perfectly represent it on a flat surface (think about peeling an orange and trying to lay the peel perfectly flat). We then dug into thinking about and discussing why we still use the Mercator map, 450 years later, when we have made vast discoveries in space and mathematics:
- We don’t typically question the systems that serve the dominant culture (usually, and in this case, European)
- It fits well with the history that we usually learn about, centered around Europe and not looking at the perspectives of the people who were in the Americas first
- We often frame the history of European conquest as “discovery” of new land, when the truth is that people were already living and thriving in those places
- We have a pattern of giving white men credit for things P.o.C. already did (“Colombusing”)
- These aren’t things that most people consciously think about. More like an invisible set of values that we become comfortable with because we don’t really know any different or it doesn’t affect us personally
This was a lesson on determining whether or not there is a proportional relationship in a real life situation. Students were given the scenario: Ms. Katelyn is going camping at Big Basin State Park with her family. Entrance to the park costs $6 per vehicle, plus $2 per person in the car.
In facilitating this lesson, I used anticipatory planning to map out possible strategies students might use, as well as misconceptions that might come up. To frame the lesson, I asked students to identify strategic key concepts that would support them as they moved into group work. For example, I asked for volunteers to remind us how we know if there is a proportional relationship between quantities. I also preemptively identified students with low math agency and used the following strategies with them:
In facilitating this lesson, I used anticipatory planning to map out possible strategies students might use, as well as misconceptions that might come up. To frame the lesson, I asked students to identify strategic key concepts that would support them as they moved into group work. For example, I asked for volunteers to remind us how we know if there is a proportional relationship between quantities. I also preemptively identified students with low math agency and used the following strategies with them:
- Publicly recognize a strength you see in their work
- Prep/encourage them to restate a strategy in class, ask a question, or share an idea (this can be seen in the video clip)
- Spotlight their work, emphasizing a way of being mathematical
